Here is how we turn raw UAS imagery into stand density maps and statistics, step by step.
Step 1
What We Work With
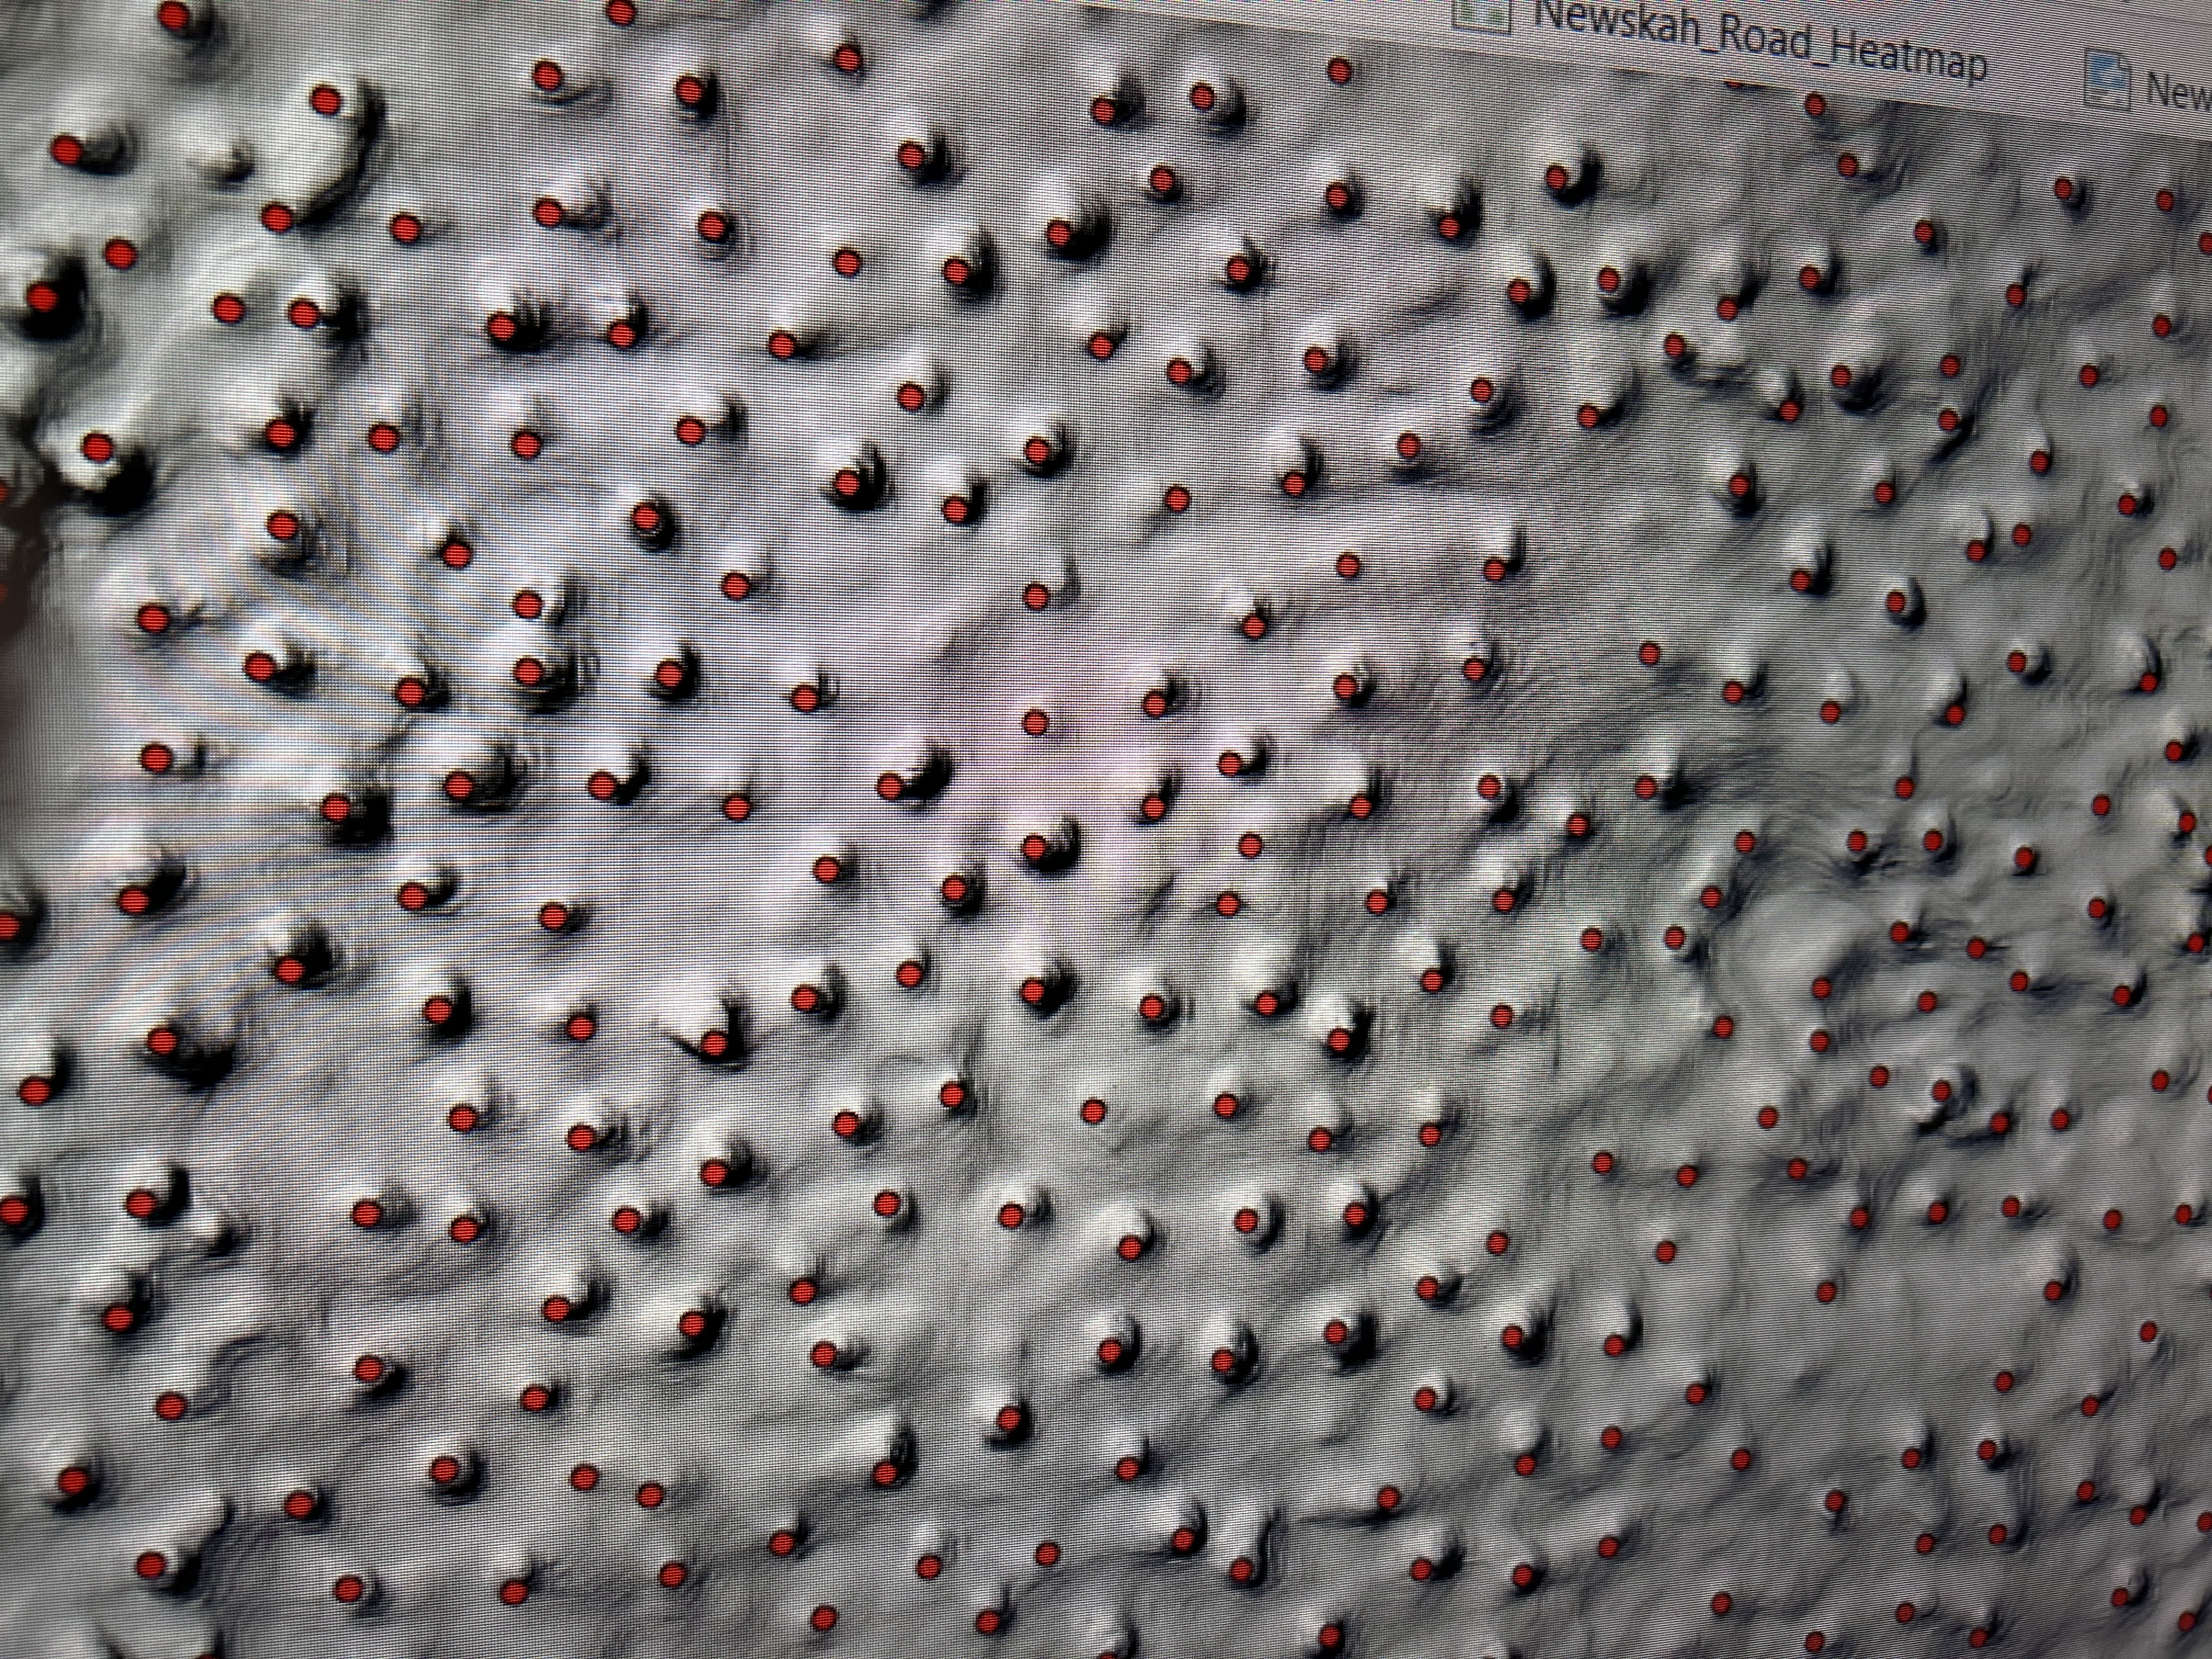
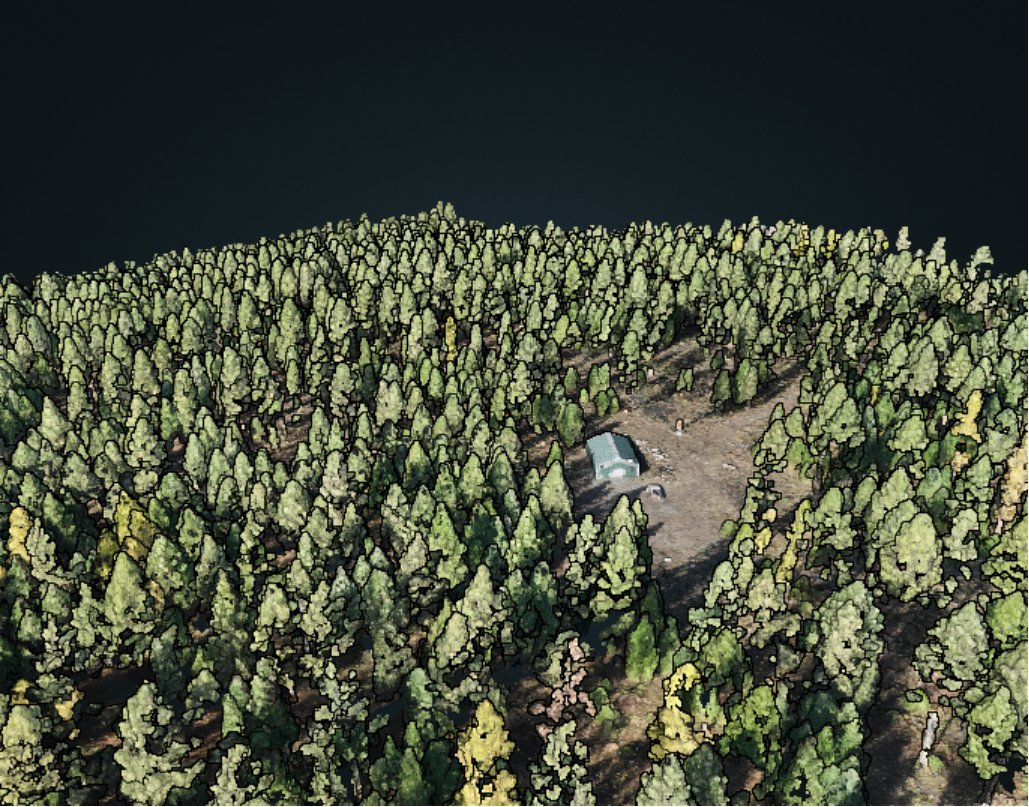
Every forestry deliverable starts with raw geospatial data from your UAS flight. We process imagery into the elevation models and point clouds that power tree detection and analytics.
Digital Surface Model (DSM) : top-of-canopy surface including tree crowns and structures. Paired with the DTM to derive individual tree heights.
Step 2
Your Orthomosaic
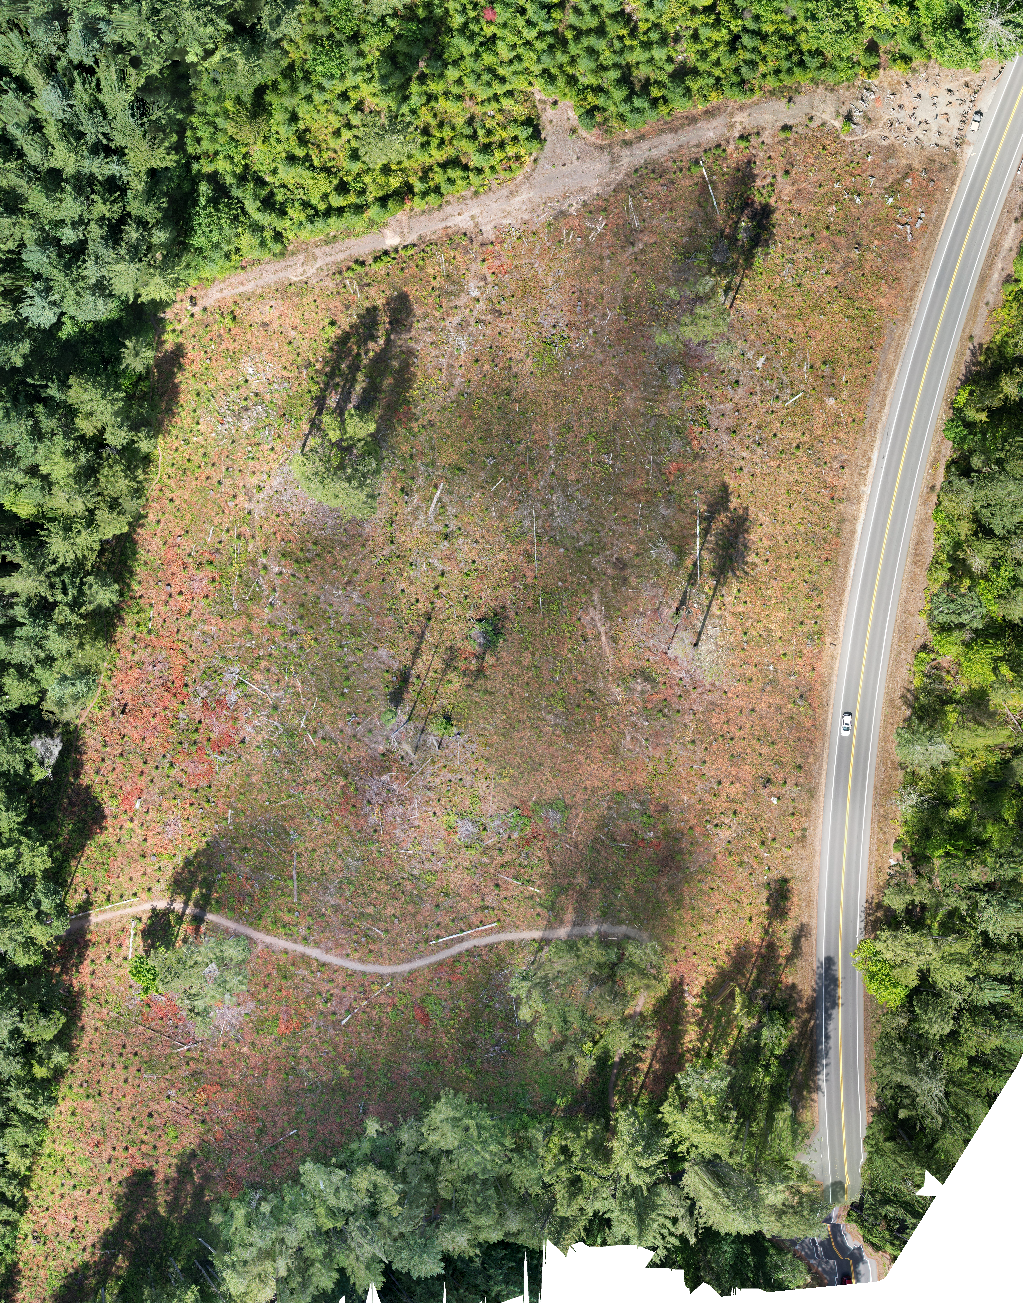
Hundreds of overlapping aerial images are stitched into a single georeferenced mosaic. This is the visual foundation for every map and report we deliver.
Orthomosaic of the McLane Creek area. A seamless, georeferenced aerial mosaic produced from UAS imagery. Load it in ArcGIS as the base layer for stocking maps, tree points, and field review.
Step 3
Segmented Orthomosaic
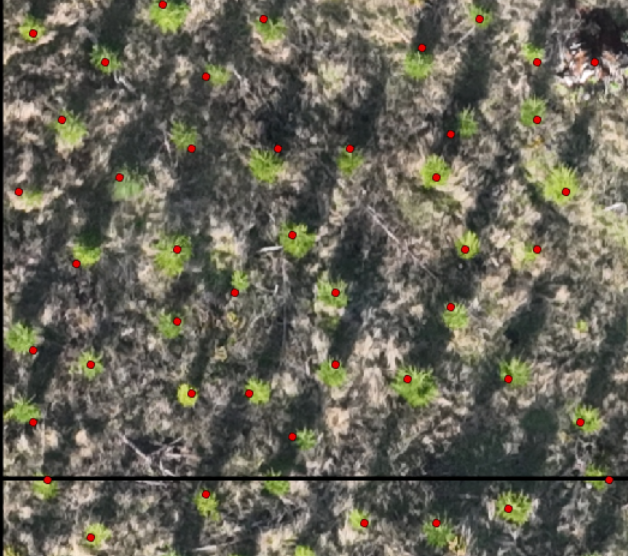
We detect and segment individual tree crowns on the orthomosaic so every stem gets counted. This is the starting point for stocking, spacing, and gap analysis.
Each dot represents a detected tree crown. These segmented locations feed directly into trees-per-acre calculations and stocking summaries.
Step 4
Density Analysis
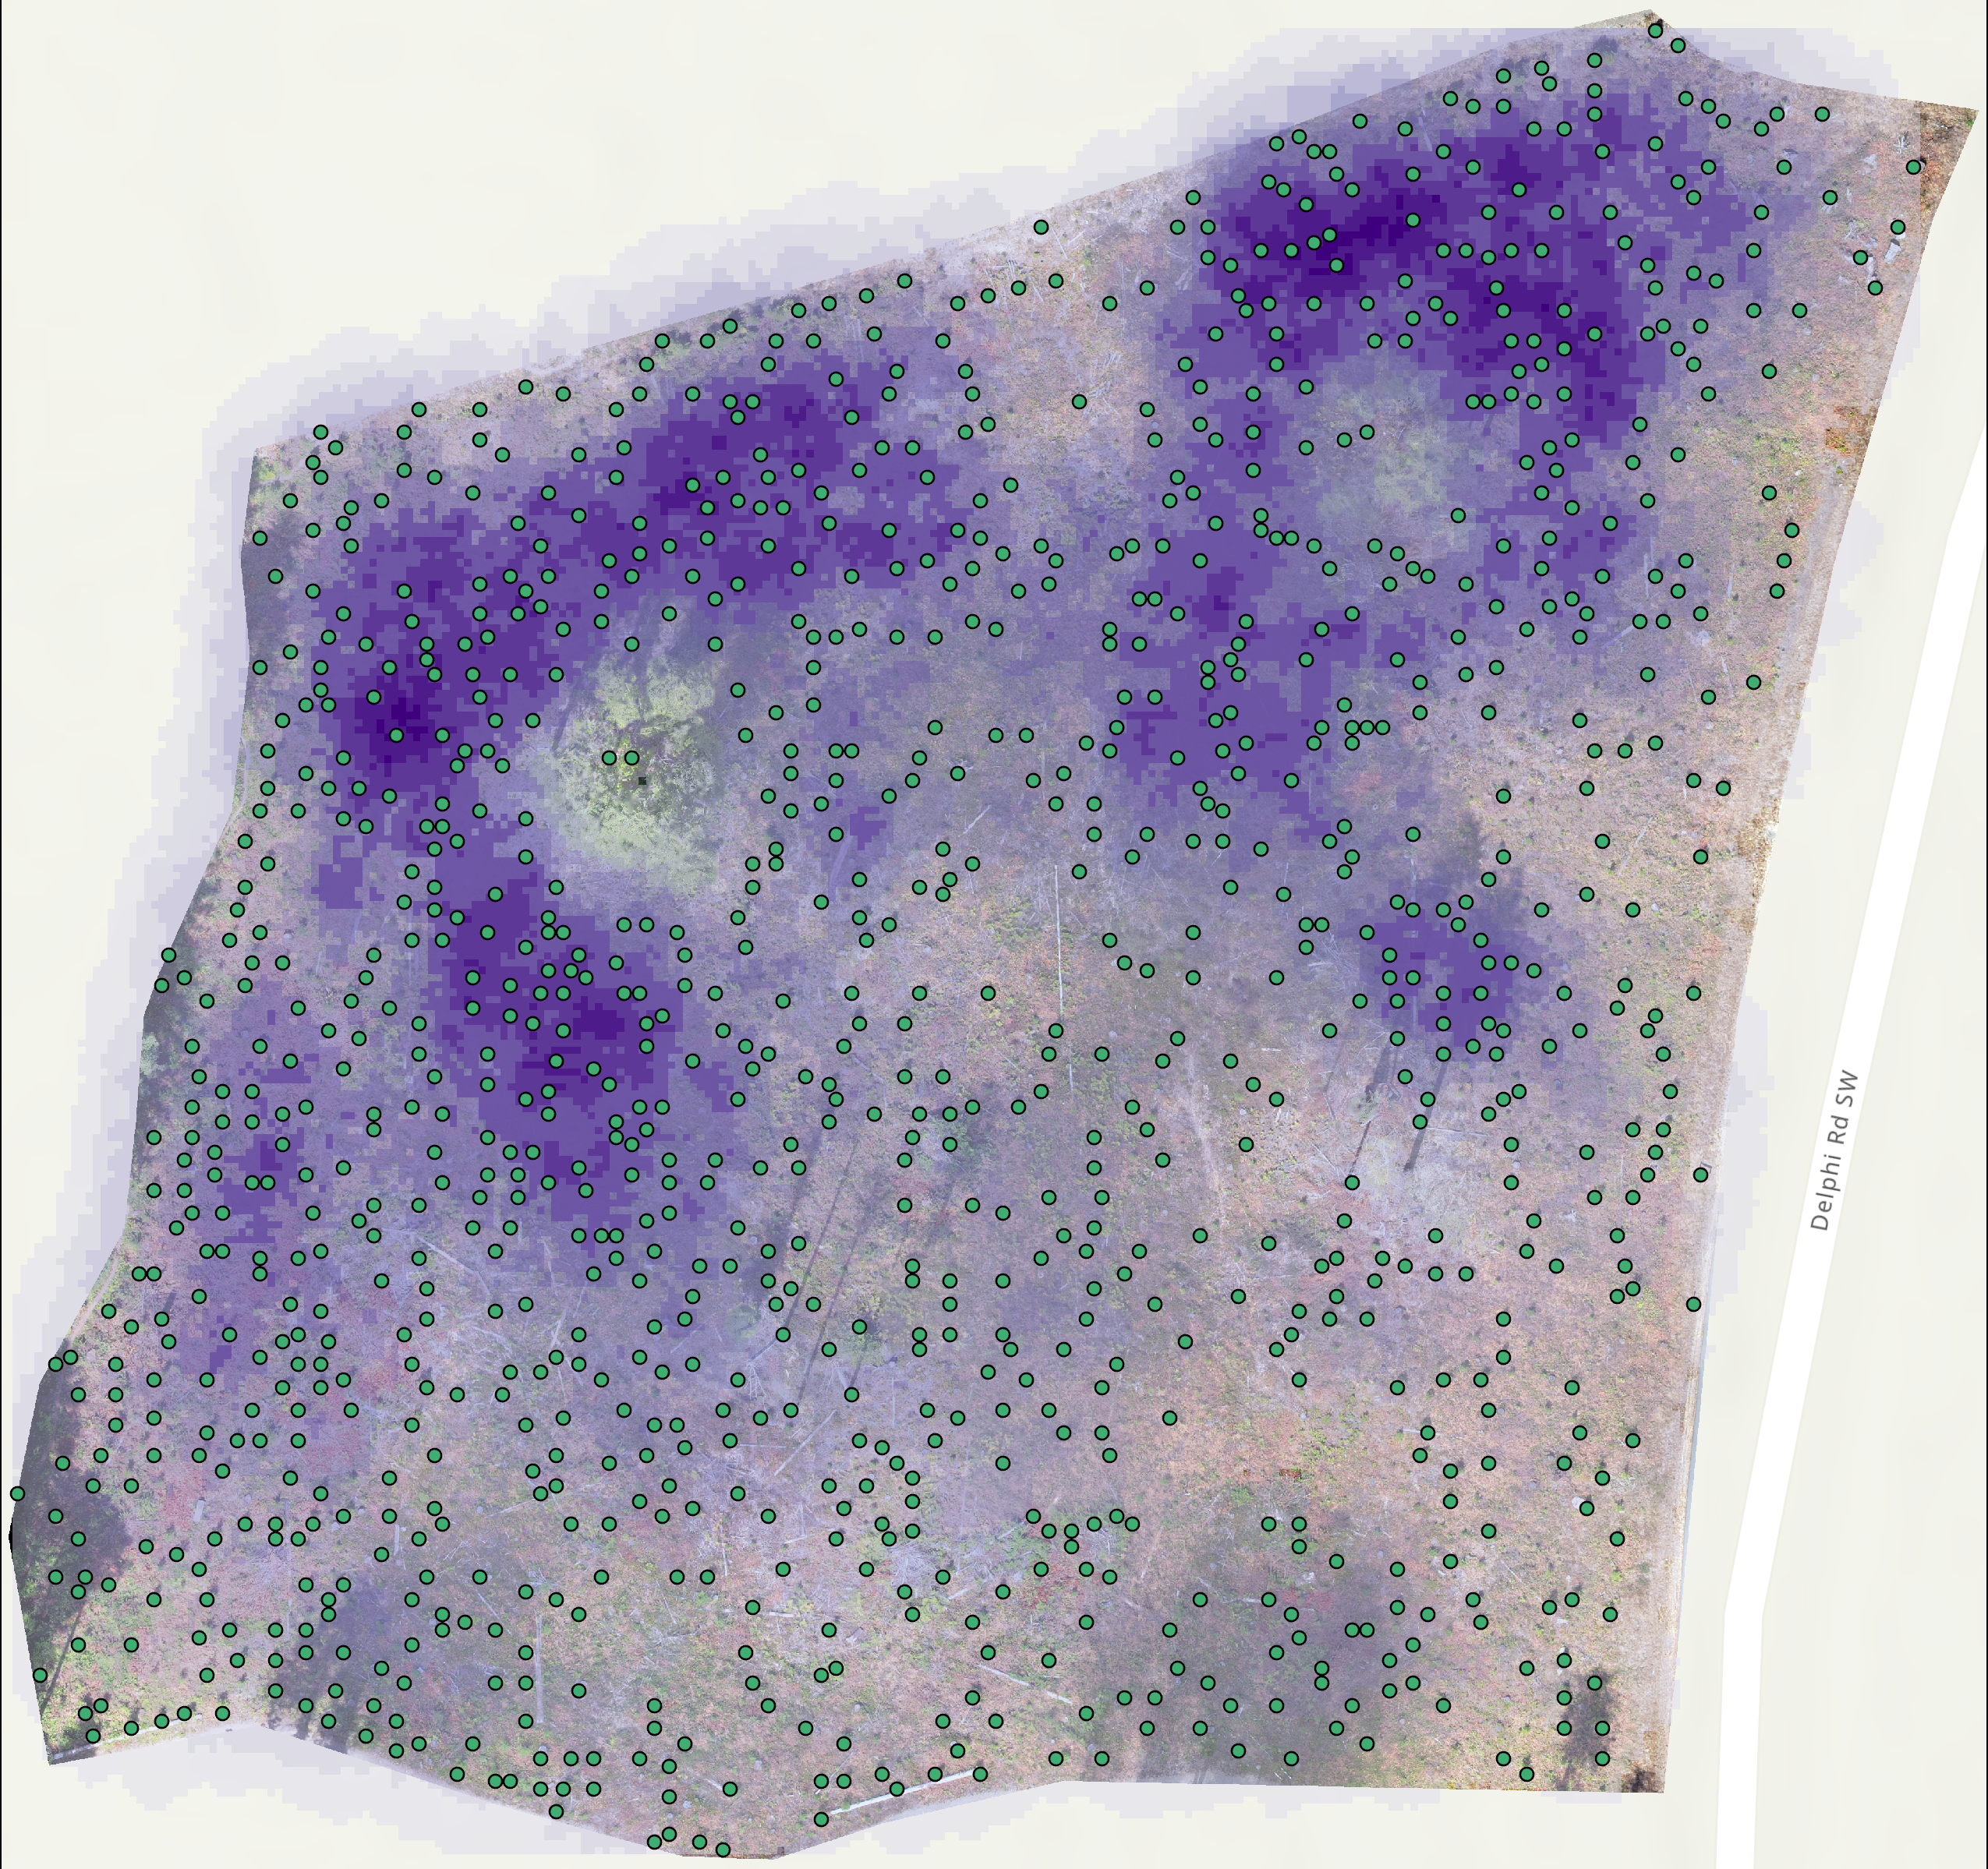
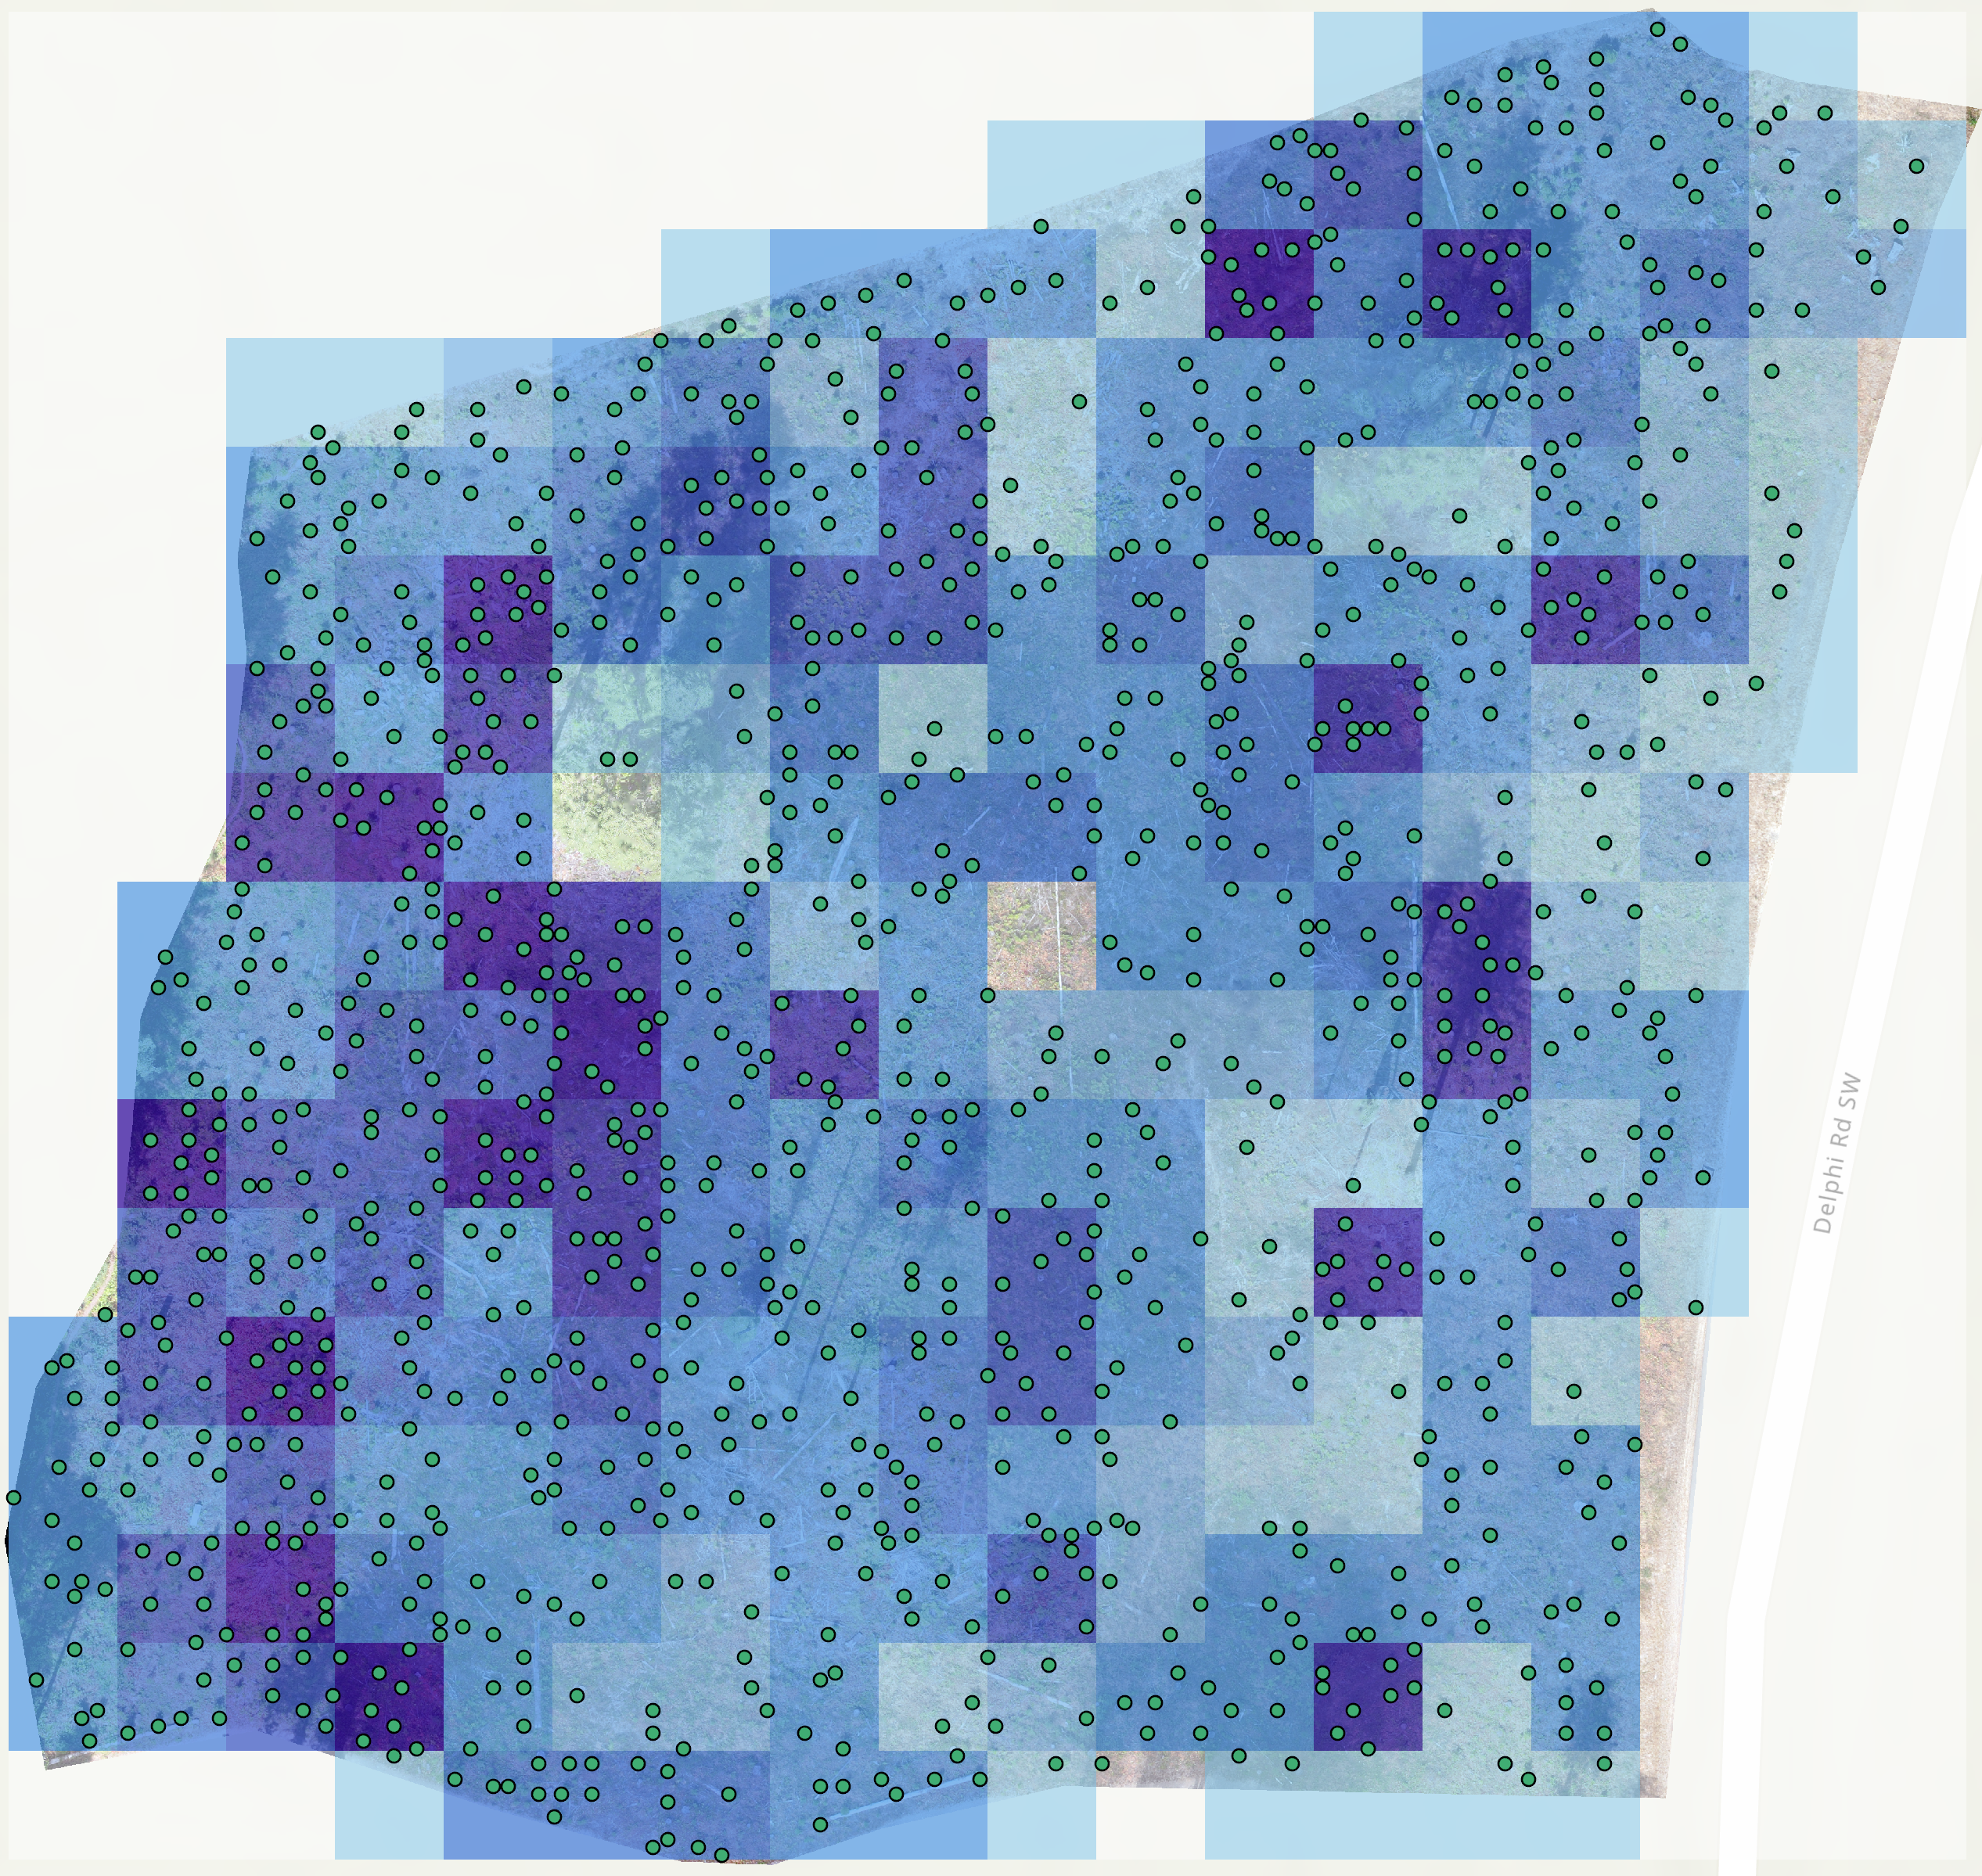
Once trees are located, we summarize stocking spatially so silviculture teams can see where density is high, low, or patchy across the unit.
Density heatmap : color-coded stocking intensity across the stand. Quickly spot understocked patches, dense pockets, and areas that need follow-up.